top of page
Engineering Design and Analysis Race Car Rear Wing CFD (Spring 2021)
For my Engineering Design and Analysis course, I developed more than 10 rear race car wings with NACA 15112 airfoils in SolidWorks. Computational fluid dynamics (CFD) was performed on all wings with the Flow Simulation feature to determine downward force, downforce to drag ratio, and efficiency. The wings were tested at a wind speed of 50 m/s.
Iterations of wings were conducted by varying size, number of airfoils, design of end plates, and testing streamlined struts. The best design, shown in the figure below, consisted of two airfoils with a span of 0.98 m and a chord of 0.913 m that were connected with end plates. This design had a downforce of 898.205 N, a downforce to drag ratio of 4.16, and an efficiency of 14.95.
Race Car Rear Wing CFD: About
Race Car Rear Wing CFD: Image
For this project, the maximum wing size was 1m x 1m x 1m. The maximum computational domain was 2m x 2m x 2m with at least 0.75 m of space needed between the furthest back point of the wind and the boundary of the domain.
Efficiency was calculated as:
Efficiency= (Downforce/250) x (Downforce/Drag)
The NACA 25112 was first modeled in SolidWorks with an angle of attack of 0 and tested under the given conditions. The results did not meet the minimum requirements. To address this, the angle of attack was changed. The best lift to drag ratio for this wing type occurs when the angle of attack is between 5 and 10 degrees. Thus, 7 degrees was picked as the initial angle of attack.
Race Car Rear Wing CFD: Text

Race Car Rear Wing CFD: Image
Further changes to angle of attack and chord were made. Once the wing performance was optimized, a second, smaller foil was added. It was connected to the larger foil with a streamlined strut.
Race Car Rear Wing CFD: Text

Race Car Rear Wing CFD: Image
A second strategy to connect the airfoils was also tested. This method used endplates. Many iterations were made with the end plates by experimenting with airfoil size, plate size, cutouts in plates, and plate shape. These can be seen below.
Race Car Rear Wing CFD: Text

Race Car Rear Wing CFD: Image

Race Car Rear Wing CFD: Image

Race Car Rear Wing CFD: Image

Race Car Rear Wing CFD: Image
The dimensions, forces, and efficiencies for all wings designed are given in Table 1.
Race Car Rear Wing CFD: Text

Race Car Rear Wing CFD: Image
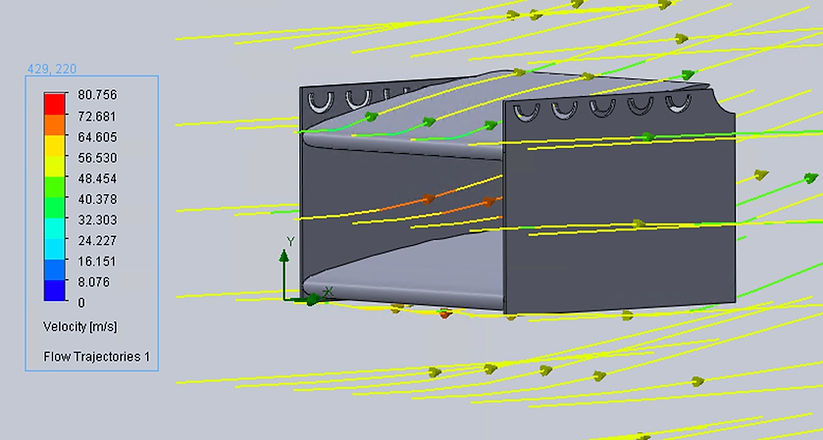
Looking at the results above, it is clear that the designs with end plates and U shaped cutouts performed better than those without. The end plates stop air from leaking around the wing tips. Air leakage can cause vortices to form at the back of the wing, which increases drag. The designs with U shaped cutouts at the back of the wings also performed better than those without because they help further reduce vortices.
Looking at the flow trajectories, the final design had the smallest velocity at the top airfoil of and the biggest maximum velocity underneath both foils. This allowed for the greatest velocity difference in the designs, and thus the greatest pressure difference.
This design could be improved by experimenting with different airfoil shapes that have different Cl/Cd values or mixing different airfoil shapes for the top and bottom sections of the wings. The design could also be modified to reduce drag by experimenting with end plates with curved edges. Decreasing the thickness of the endplates from 10 mm to 7 or 5 mm may also help reduce drag. Moreover, the distance between the wings could be increased further by changing the plate height to 1 m, which would still meet the assignment criteria.
Race Car Rear Wing CFD: Text
bottom of page