Enclosure Optimization Independent Study with World Wildlife Fund (Spring 2021)
In Spring of 2021, I worked with World Wildlife Fund's Wildlife Crime Technology Project to determine best practices for designing electronic enclosures that would minimize temperature and maximize air flow. See my full report here and related interview series with experts here.
World Wildlife Fund and other conservation organizations often use networking and monitoring equipment to protect wildlife in remote locations. This involves setting up cell towers, wifi networks, and solar panels to power the equipment. All equipment (wifi, ethernet, converters, batteries) needs to be stored, but this storage is not often conducive to high heat environments, leading to equipment failure.
The goal of my project was to determine best practices for passively-cooled enclosures used in harsh environments. Harsh was defined as high temperature, humidity, and precipitation. The enclosures are meant to store batteries, networking equipment, and other technology needed to monitor wildlife in protected areas. The enclosures needed to maximize airflow to ensure any enclosed batteries have proper ventilation. They also needed to minimize temperature and prevent moisture from getting in. Designing for animal and insect resistance was also considered in the design process.

Three interviews were conducted with experts in the field of conservation tech: Eric Becker from World Wildlife Fund, Tim van Dam from SmartParks, and Juan Swart from Techlink to hear about and learn from their experiences with enclosures.
Based on their feedback and research on existing enclosures, I created 7 CAD models of different passively cooled enclosures with SolidWorks. I conducted flow simulations on these models, where air temperature was 48 Celsius, modeling the highest temperatures that may occur, to determine which enclosure types had the most airflow and lowest temperatures. All enclosures had the same base shape and dimensions. They differed by the number and placement of cutouts and louvers, which were used for passive cooling.
A scale model (shown above) of one of the designs was built and tested. The sheet metal (0.0359" A366/1008 cold rolled mild steel) for the model was machined with the water-jet at the Duke University Innovation Co-Lab. Illustrator drawings were made and uploaded to the waterjet so that it could correctly make the needed cutouts.


The thermal analysis was done through CFD in SolidWorks. I performed flow simulations and looked at the volumetric flowrate of air exiting through the bottom cutout, the average temperature of the electronics, the maximum air temperature of a cross section through the middle of the enclosure, and the highest temperature on the enclosure walls. The temperature of the air and starting temperature of all components was set at 48 Celsius, as this is the highest temperature that Juan has experienced while developing enclosures in Zambia.
For the modeled electronics producing heat in the enclosure, I focused on the power consumption of the Cisco IR829 router, Cisco IE3200 networking switch, and Cisco DC-DC power module for POE converter, as they were responsible for generating the most heat in enclosures World Wildlife Fund had used in the past. I modeled them as one 7.44 in. cube that consumed a total of 98 Watts of electricity.
All louvers and cutouts were treated as perforated surfaces in SolidWorks, as any vents or cutouts used in real enclosures must be covered by a mesh or screen to prevent insects from getting in, which would restrict airflow.
Examples of results of the CFD can be seen here:
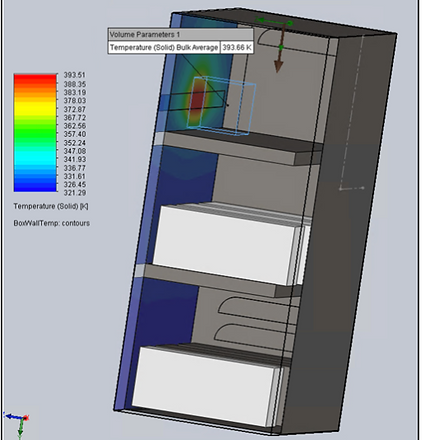


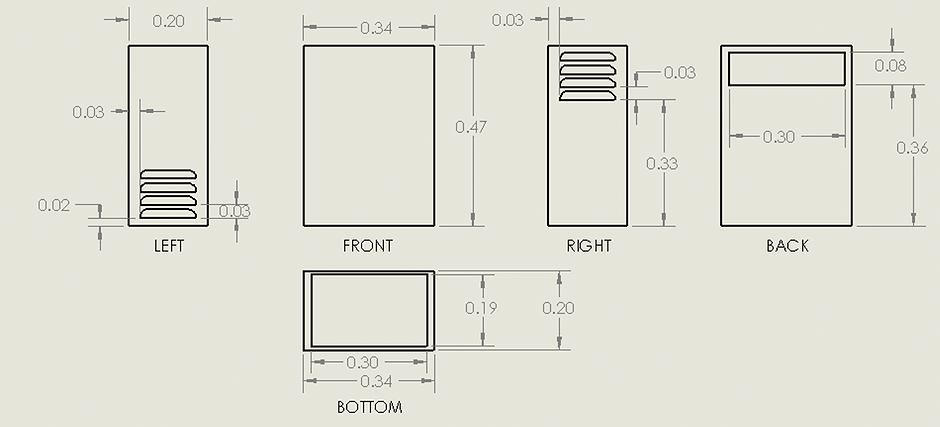
The designs yielding maximum airflow and minimum temperature are shown in Figs. 1 and 2 with dimensions given in meters. The scale model constructed was 1⁄3 the size of the full-size model. It optimized both airflow and temperature. Dimensions of the scale model can be seen below.
Images of the model tested are in the gallery below.
A data acquisition system (DAQ) and thermocouples were used to collect temperature measurements from the enclosure. The thermocouples rested against the walls of the enclosure, one just under the heating pad and the other underneath the louvers on the top right of the enclosure.
To model the conditions under which the enclosure is most likely to fail (high heat, humidity, rain), the enclosure was placed in the Temperate room of the Duke Research Greenhouse for 2.4 hours. This room had a dry bulb temperature of 77.6°F (25.33°C) and a relative humidity of 76.4%. Additionally, greenhouse staff doused the enclosure with water while watering the nearby plants. The enclosure was placed on bricks to allow air to flow out through the bottom cutout.
 |  |  |
|---|---|---|
 |  |  |
 |  |
The images above include an overhang over the cutout in the back of the enclosure where the heating pad is. This feature protects the enclosure from the rain.
The temperature data collected during testing is illustrated below.
